
I have worked on many small tools, scripts and experiments over time, but Labby is the biggest project I have built so far.
Labby is a self-hosted homelab inventory, rack and topology tool. It helps you document your hardware, virtual machines, LXCs, apps, networks, IP addresses, rack layouts and relationships in one place.
You can try the demo here:
The demo saves everything in your browser only. The self-hosted version uses persistent backend storage, so all devices and browsers can access the same data.
Why I Built Labby
Like many homelab users, I reached a point where my setup had grown beyond “I remember where everything is.”
At first, a few notes were enough. Then came more servers, VMs, containers, services, VLANs, IP addresses, ports, reverse proxies and backup systems.
At some point, you start asking yourself:
“Where is this app running?”
“Which VM hosts this service?”
“What IP did I give this device?”
“Which server is in which rack?”
I wanted one simple tool that answers these questions without becoming complicated.
That is how Labby started.
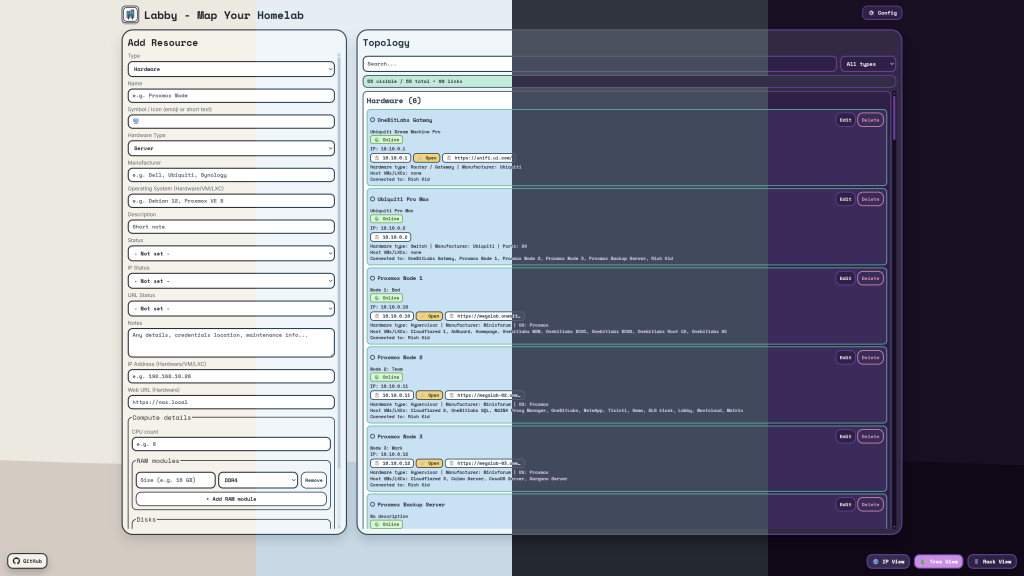
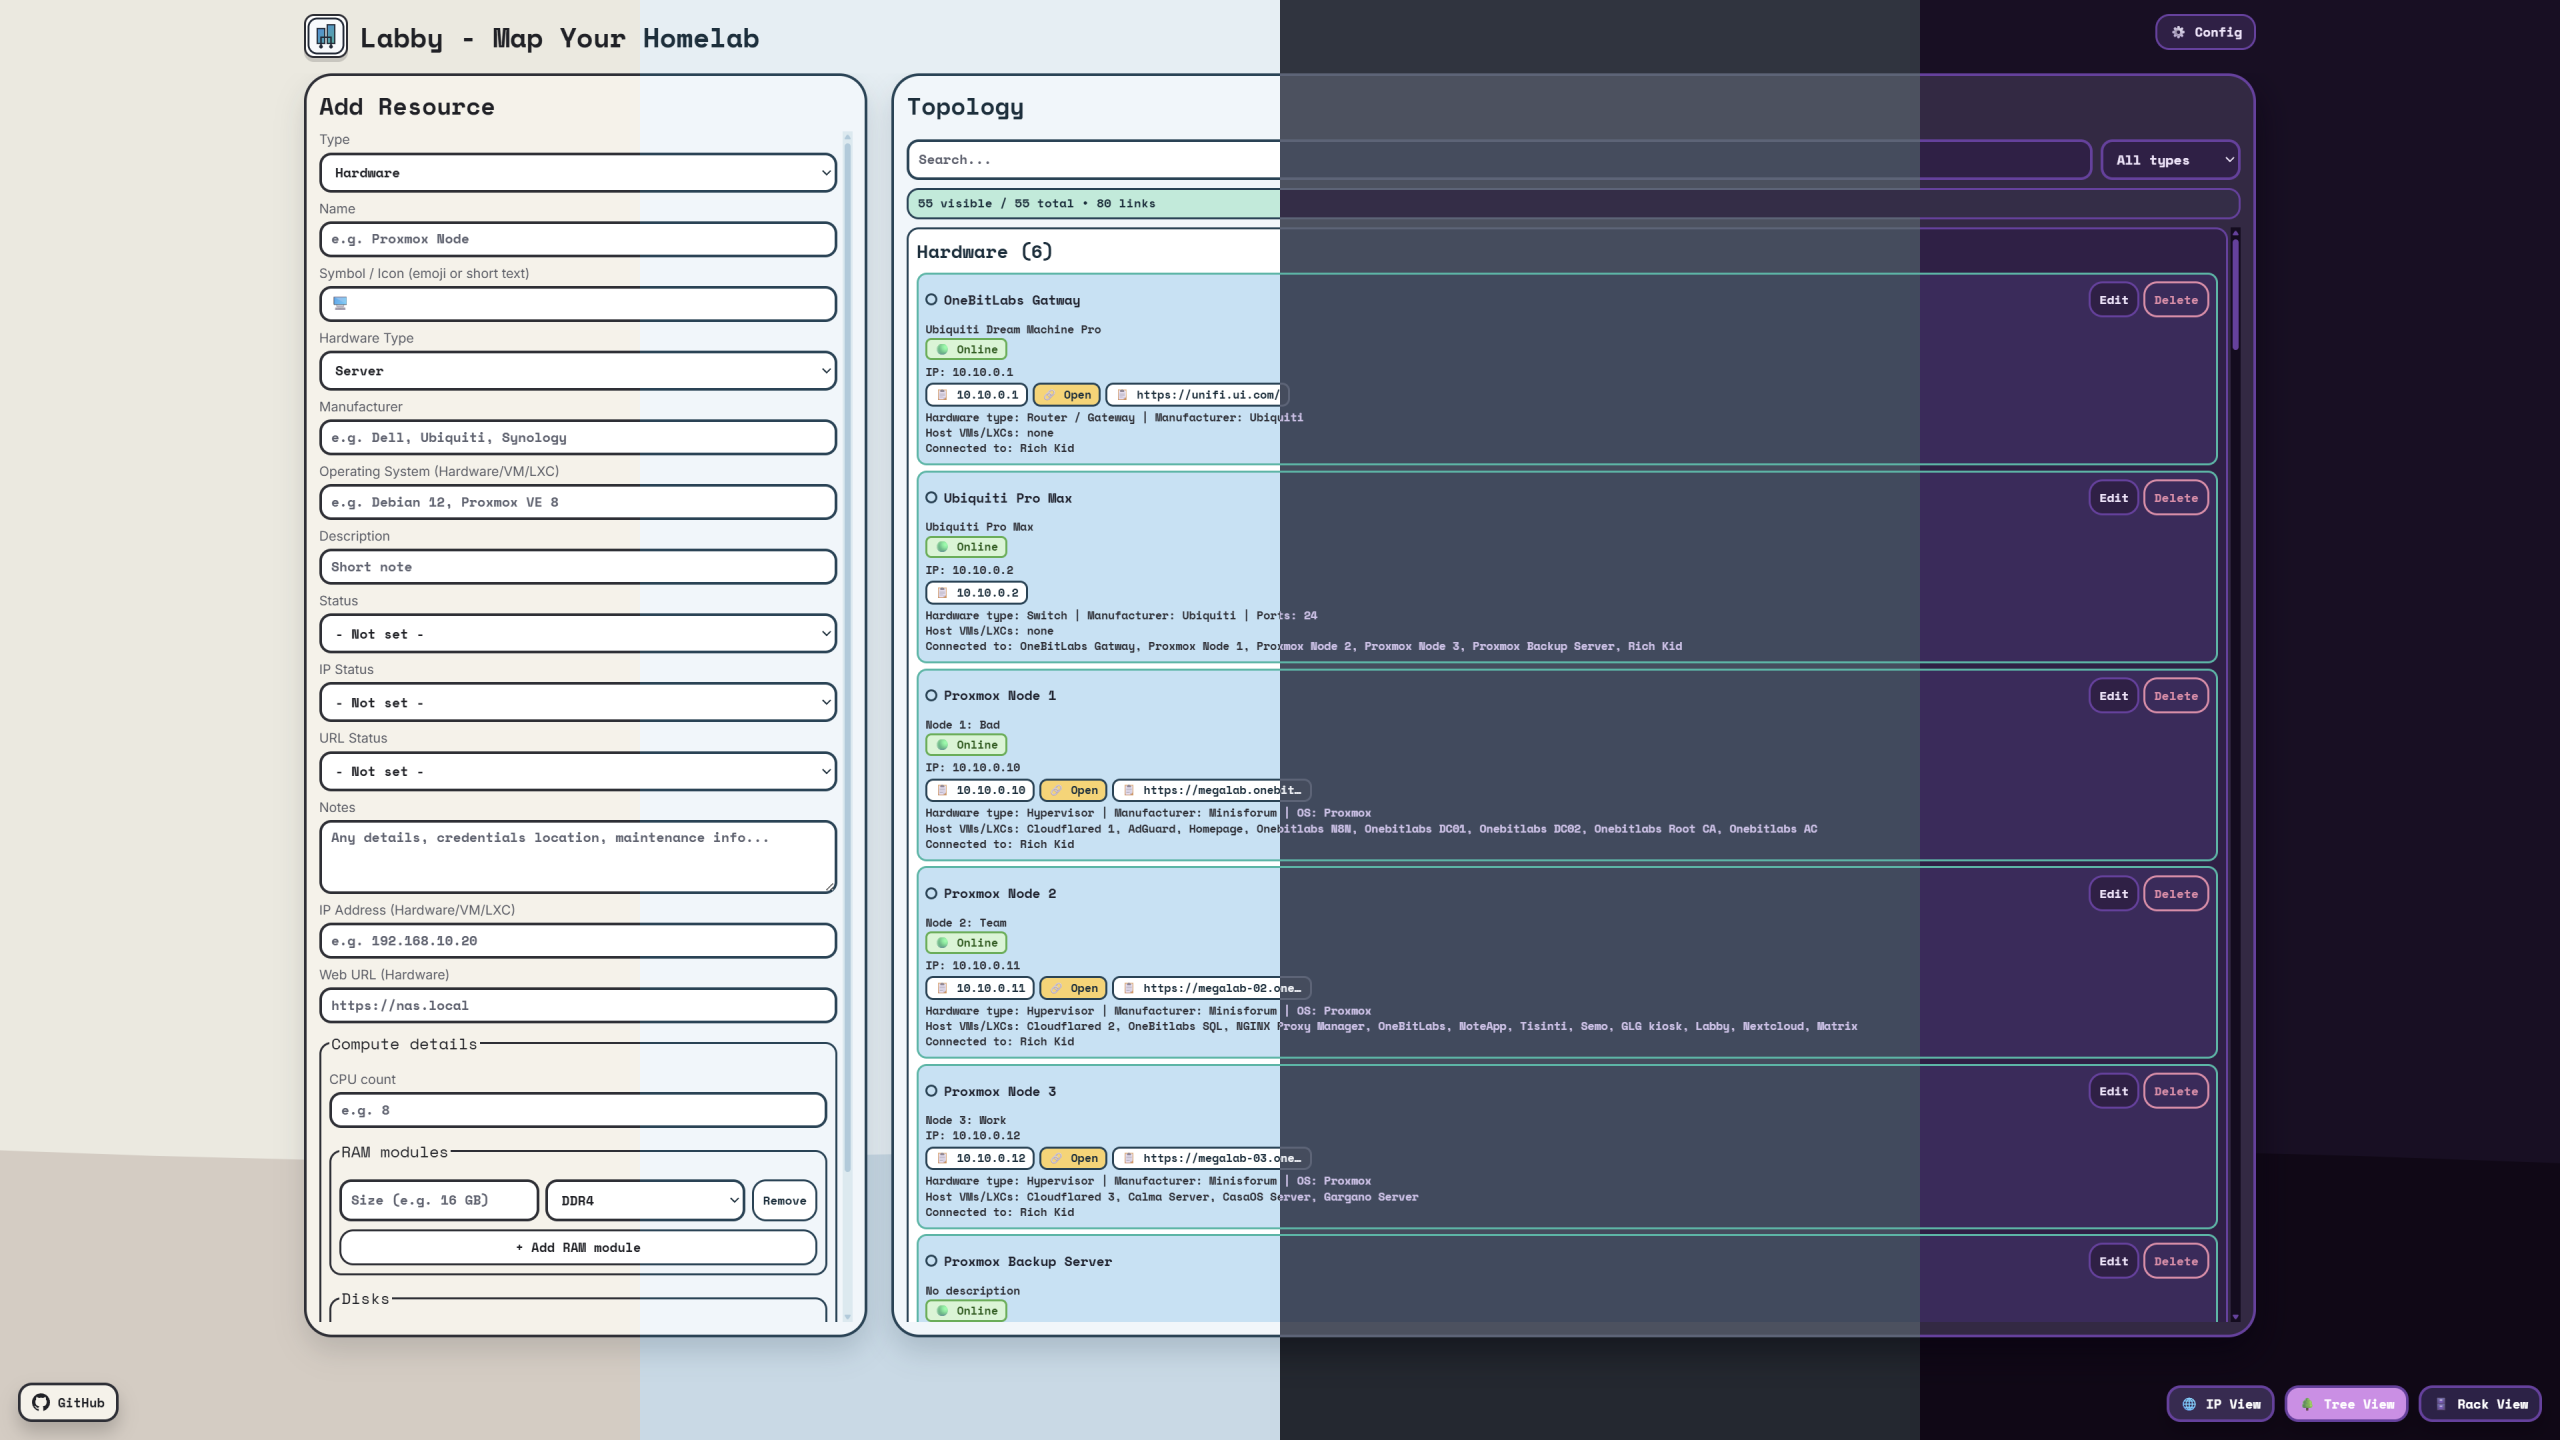
What Labby Does
Labby lets you map your homelab in a structured way.
You can add:
- Hardware
- Virtual Machines
- LXCs
- Apps
- Networks
- Locations
- Racks
Each resource can have metadata like manufacturer, operating system, CPU, RAM, disks, notes, IP addresses, ports and URLs.
But Labby is not only an inventory list. The important part is the relationship between everything.
For example:
An app can run on a VM.
A VM can run on a Proxmox host.
A Proxmox host can be connected to a switch.
The switch can be connected to a router.
The router belongs to a network.
And the device can also be placed inside a rack.
Labby tries to make this visible.
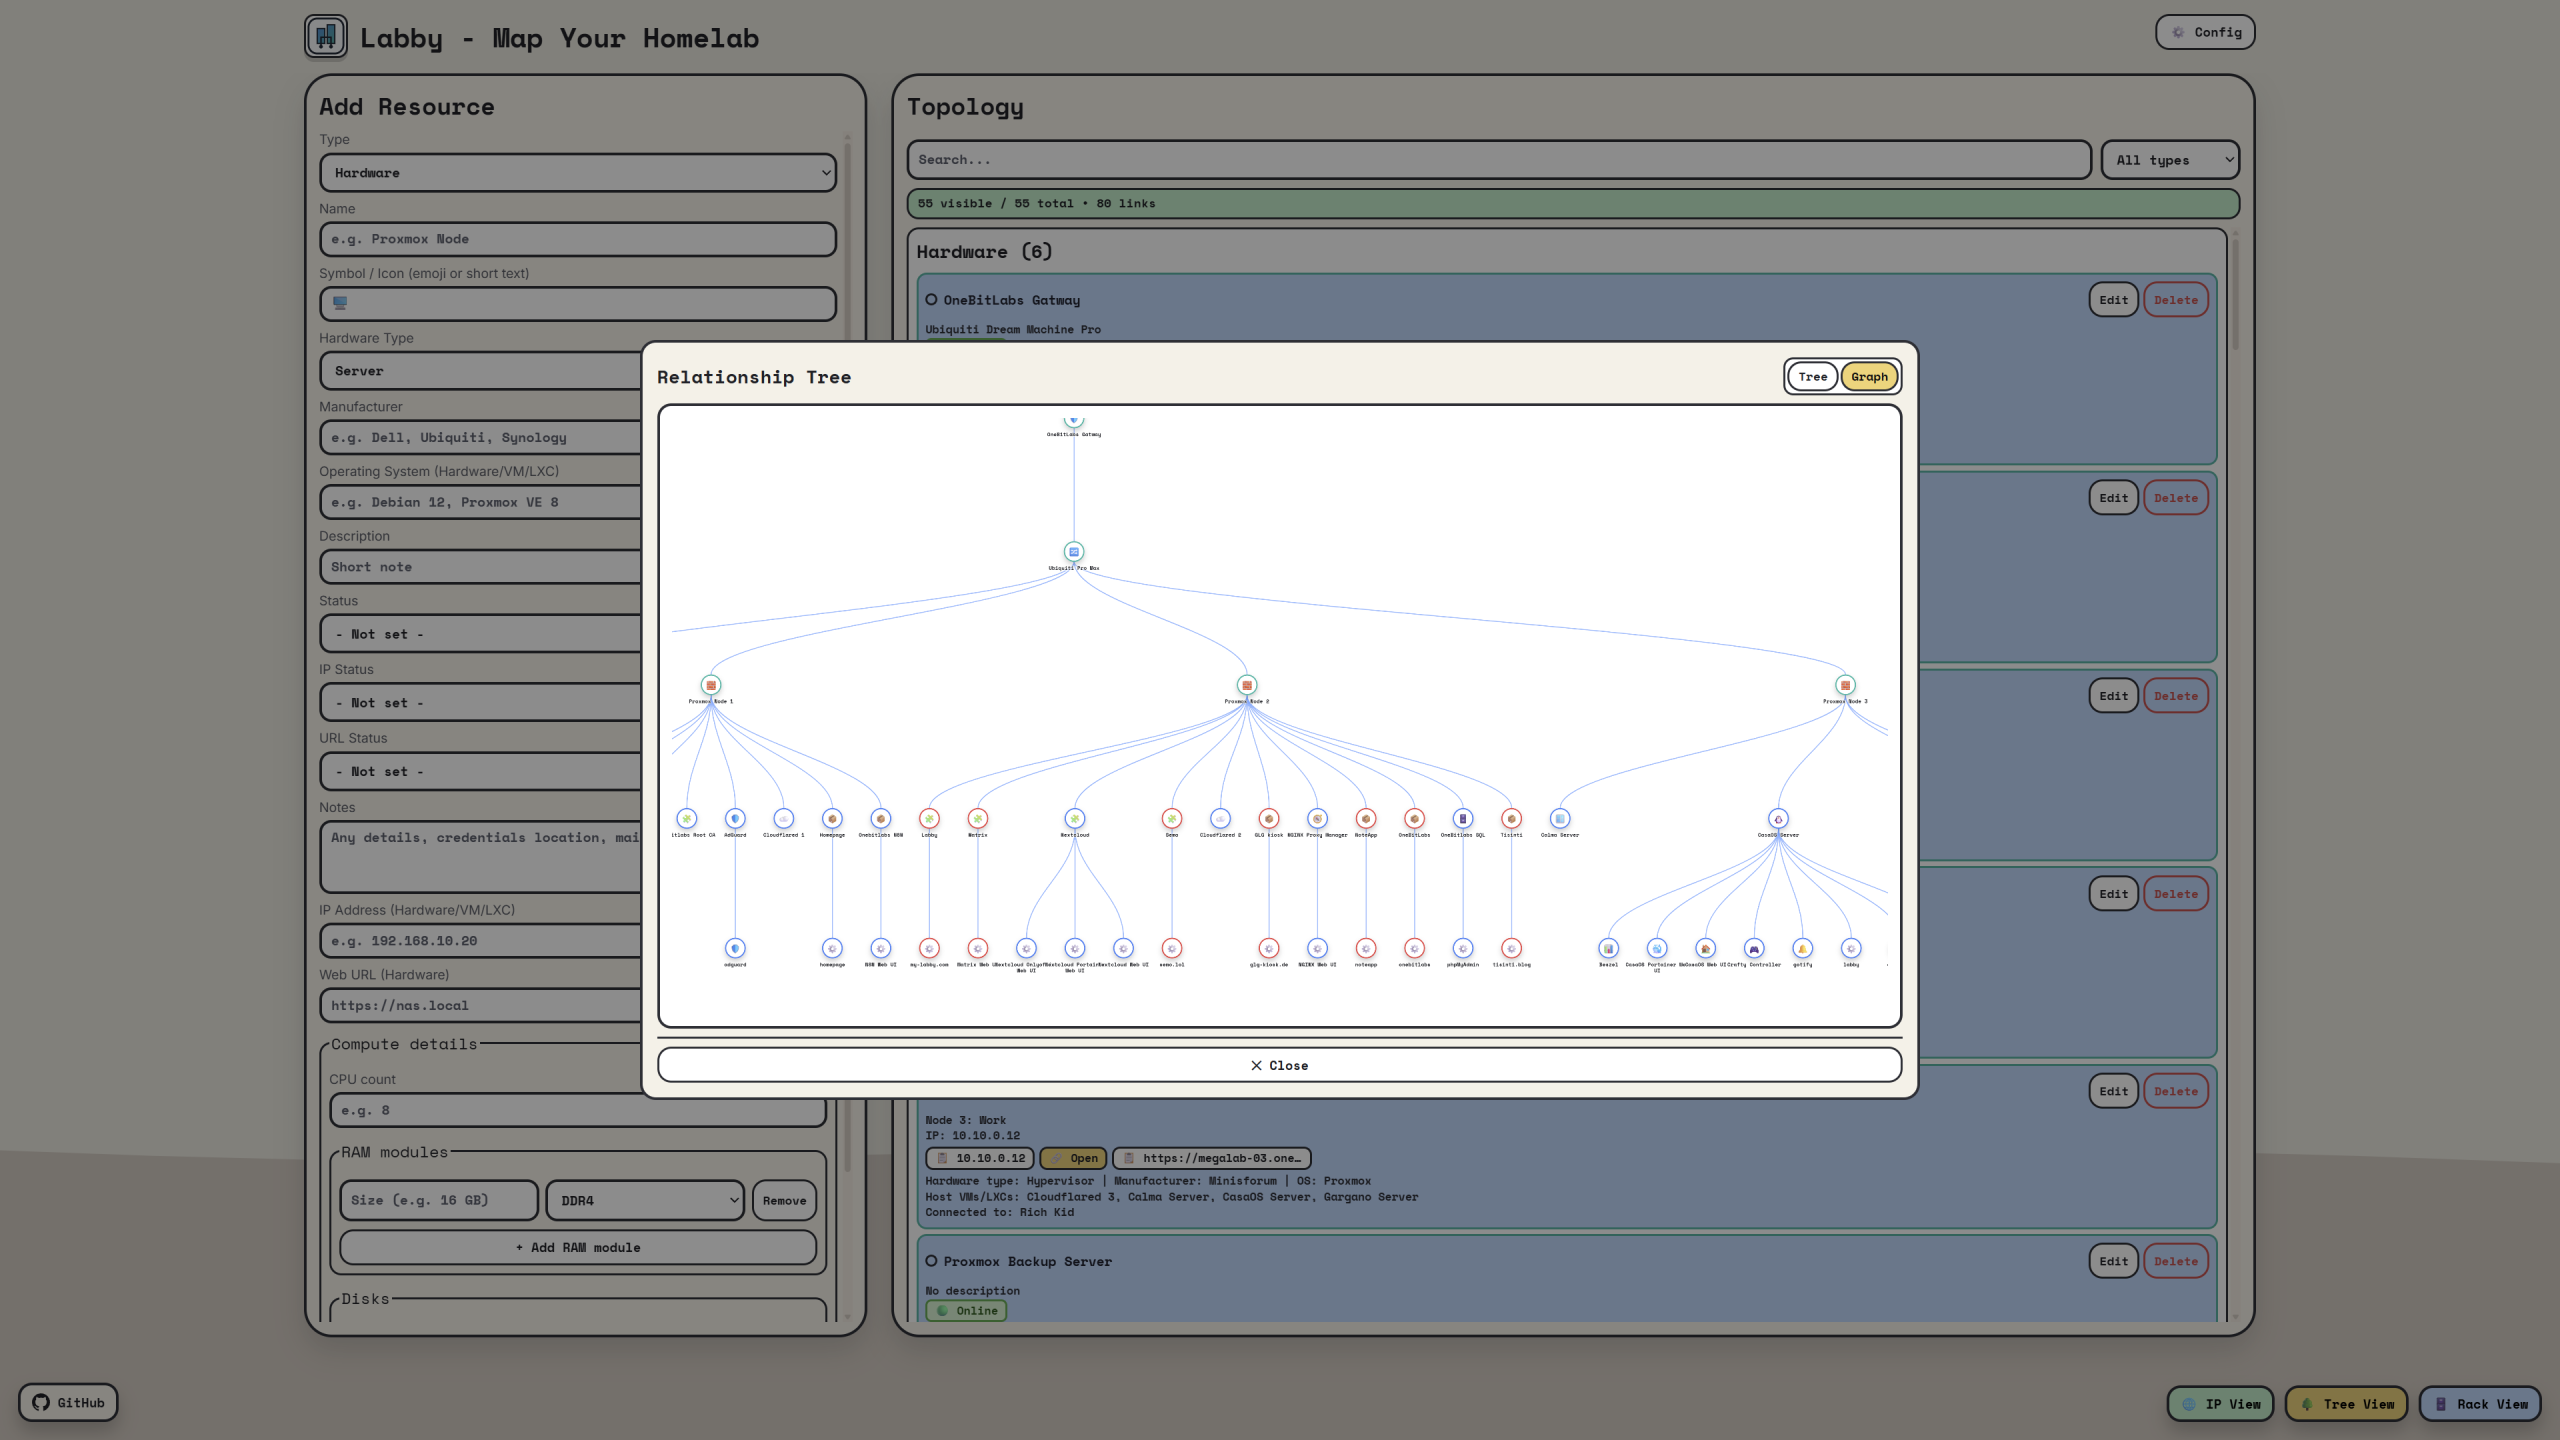
Tree View and Graph View
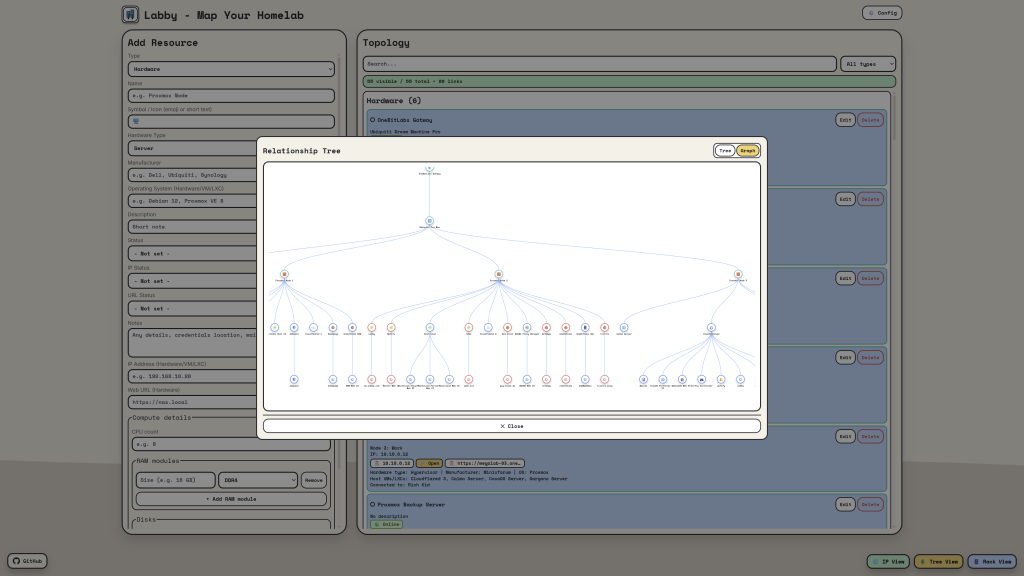
One of the most useful features is the relationship view.
The Tree View shows your infrastructure in a classic structured way. This is useful when you want to see which VMs or LXCs belong to which hardware host, and which apps belong to which VM or container.
The Graph View gives a more visual overview. Resources are shown as connected bubbles, and Labby tries to center and zoom the graph so the most important part of the topology is visible immediately.
Names are shown directly under the bubbles, and clicking a node opens the resource for editing.
This was one of the more difficult parts to get right because a real homelab graph is rarely clean. Some nodes have many children, some relationships are wide, and some connections create long branches. Making the graph useful by default took a lot of iteration.
IP View
Another feature I wanted from the beginning was a proper IP View.
Instead of searching through cards manually, Labby can show all used IP addresses grouped by subnet.
This makes it easy to see:
- which IPs are already used
- which device owns an address
- which app uses which port
- which subnet something belongs to
You can also search by hostname, IP address or port.
This is especially useful when dealing with apps like:
192.168.20.21:9000
192.168.20.22:8096
192.168.10.40:3000
Rack View
A big feature is also the Rack View.
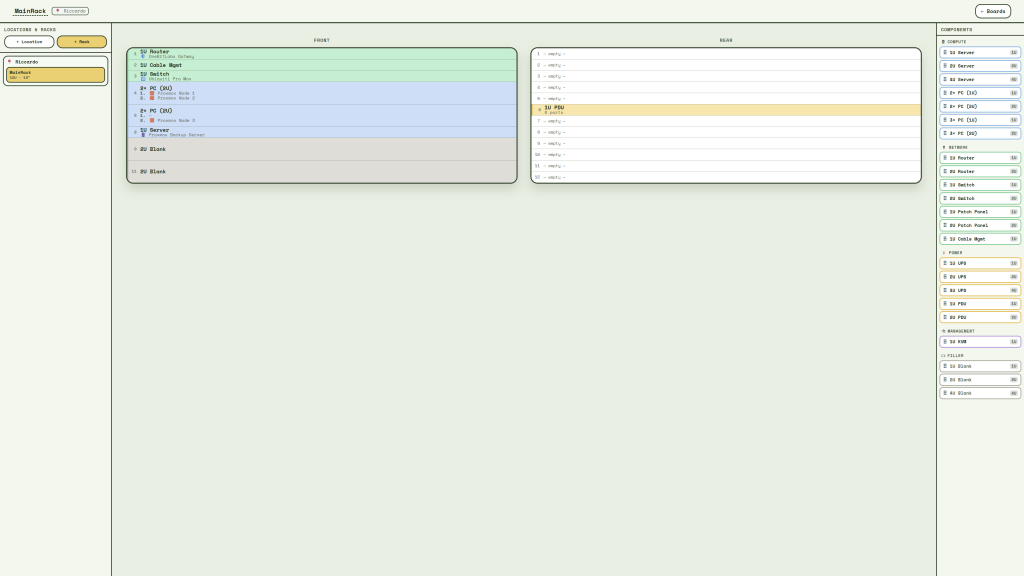
This was important to me because many homelab diagrams stop at the logical level. They show services and hosts, but not where things physically live.
With Rack View, you can create locations and racks, then place equipment into front and rear rack layouts.
Labby supports rack components like:
- servers
- switches
- routers
- patch panels
- cable management
- UPS
- PDU
- KVM
- blank panels
You can also link rack components to existing Labby resources. So the server in your rack is not just a drawing. It can be connected to the actual hardware entry in your inventory.
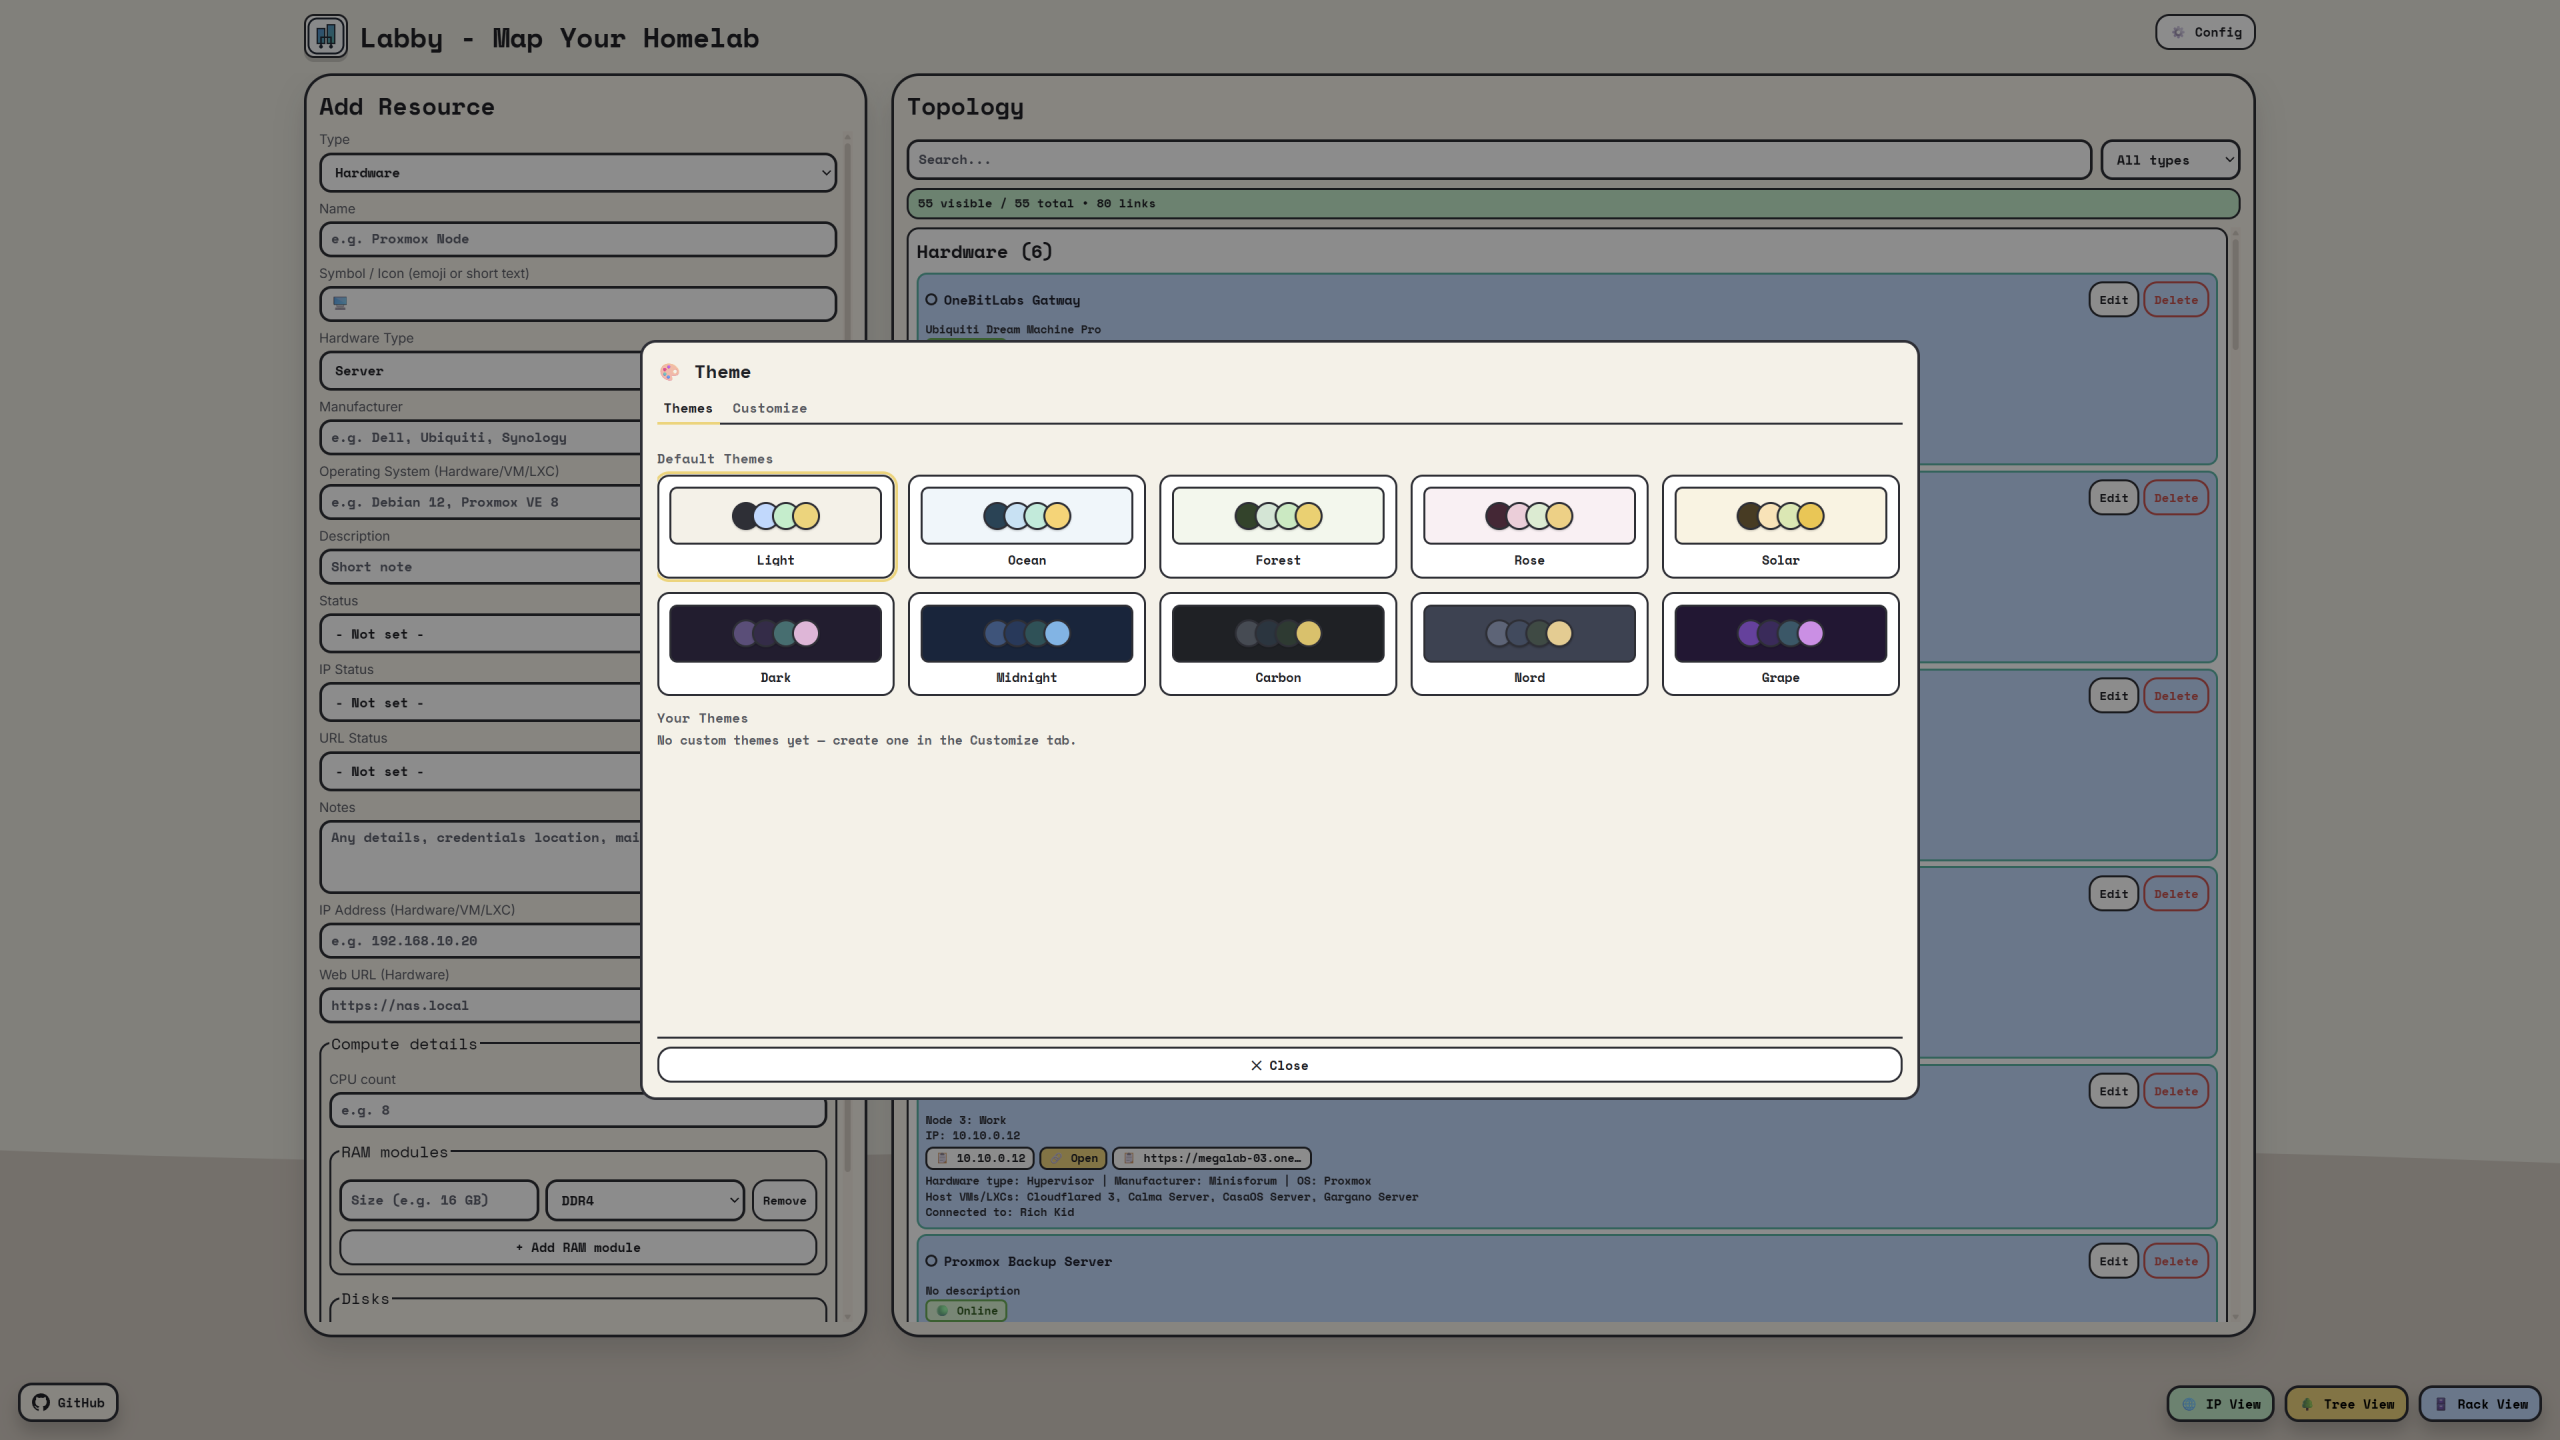
Themes and Customization
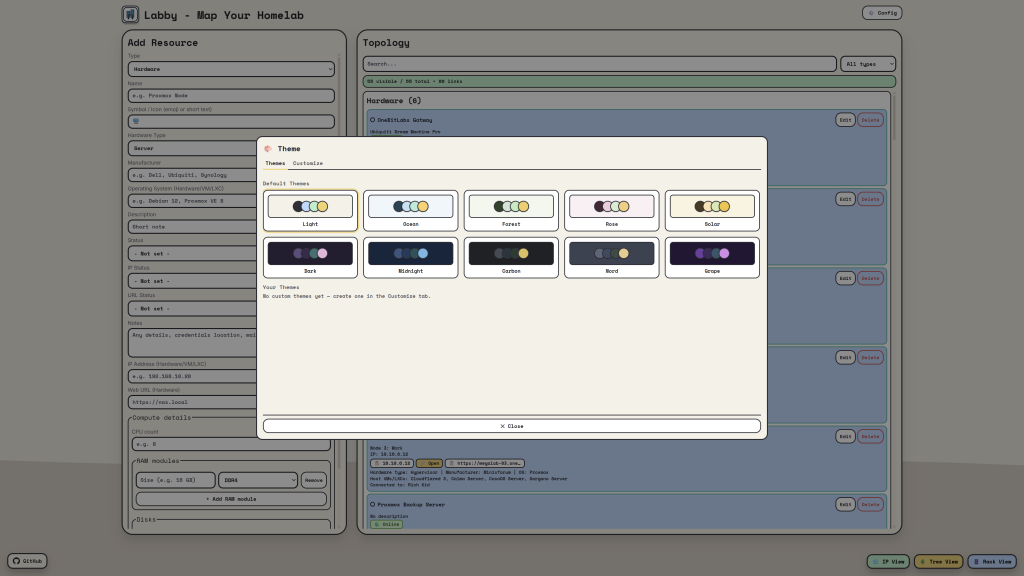
Labby also includes a theme system.
There are multiple built-in themes, and you can create your own custom themes inside the UI. Custom themes are saved and included when exporting your config.
The active theme is also exported and restored on import.
This sounds like a small feature, but for a tool you might keep open often, appearance matters. A homelab dashboard should feel like your own.
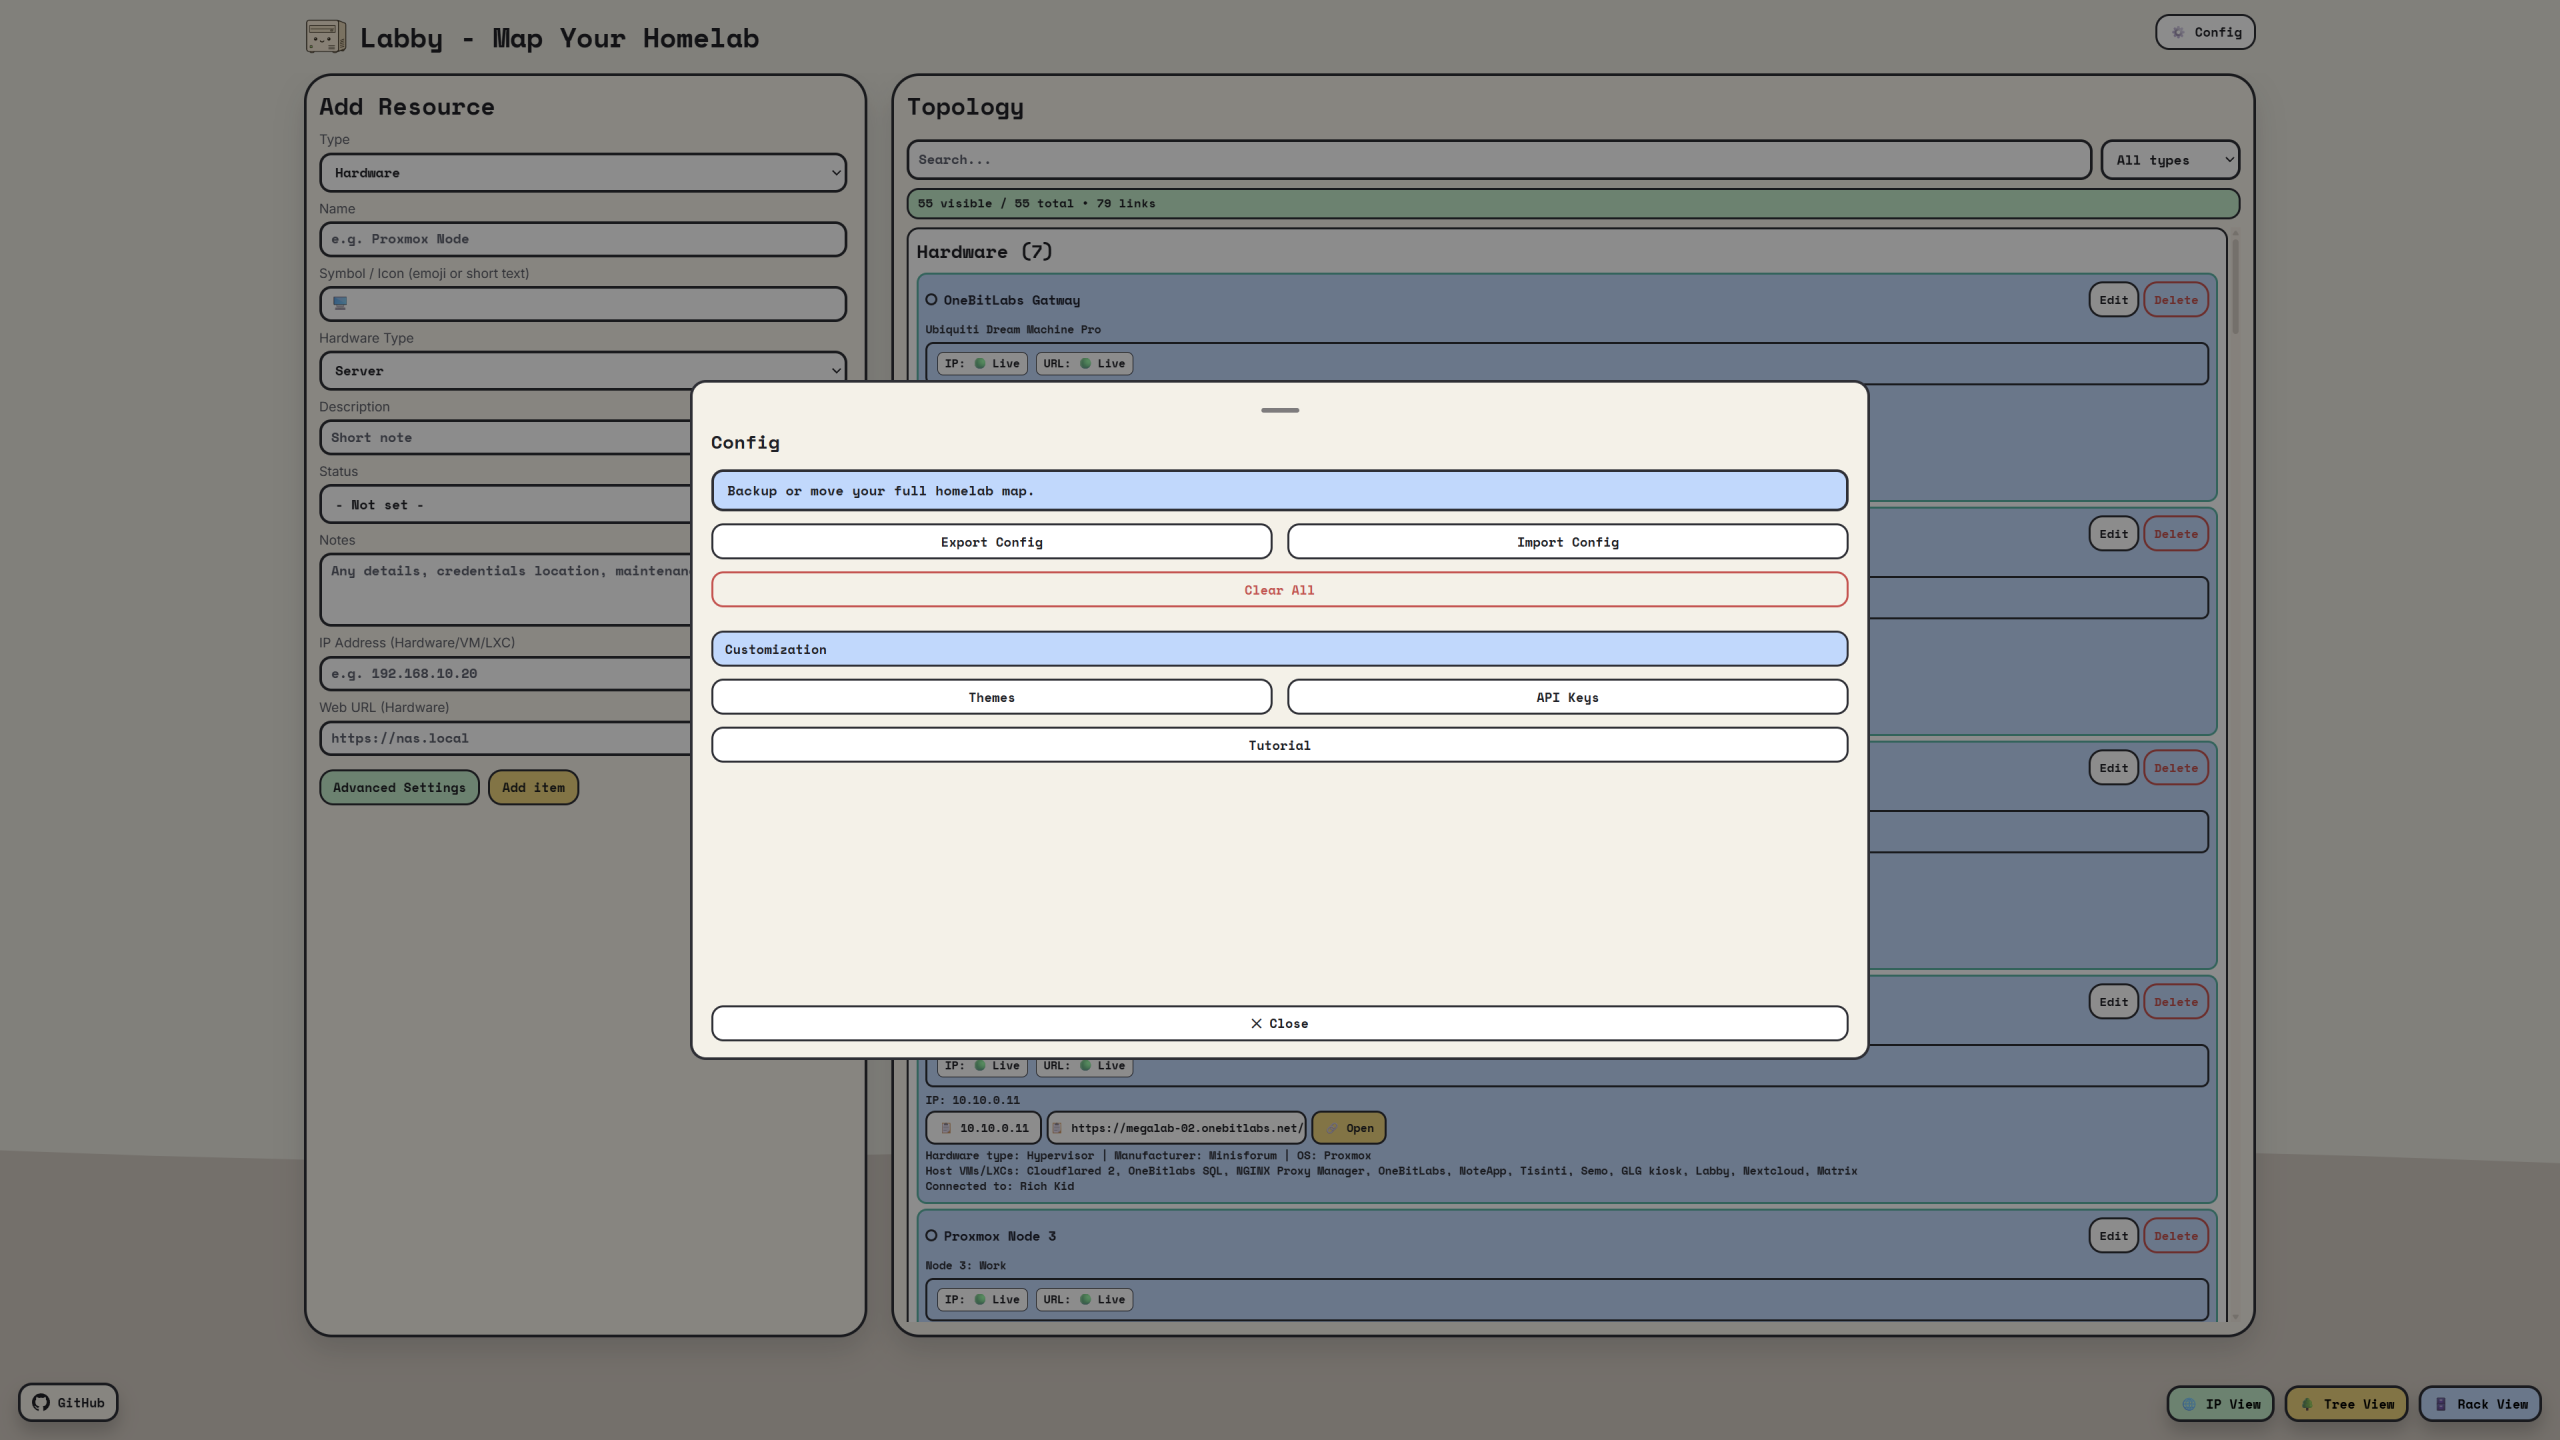
Import, Export and Persistent Storage

The self-hosted version stores data server-side in a Docker volume.
That means your data is not tied to one browser. You can open Labby from another device and still see the same homelab map.
Labby also supports JSON export and import. The export includes:
- resources
- locations
- racks
- custom themes
- active theme
- api keys
- backup configurations
This makes backup and migration simple.
Older localStorage exports from earlier versions can also still be imported.
Implemented CLI Tool
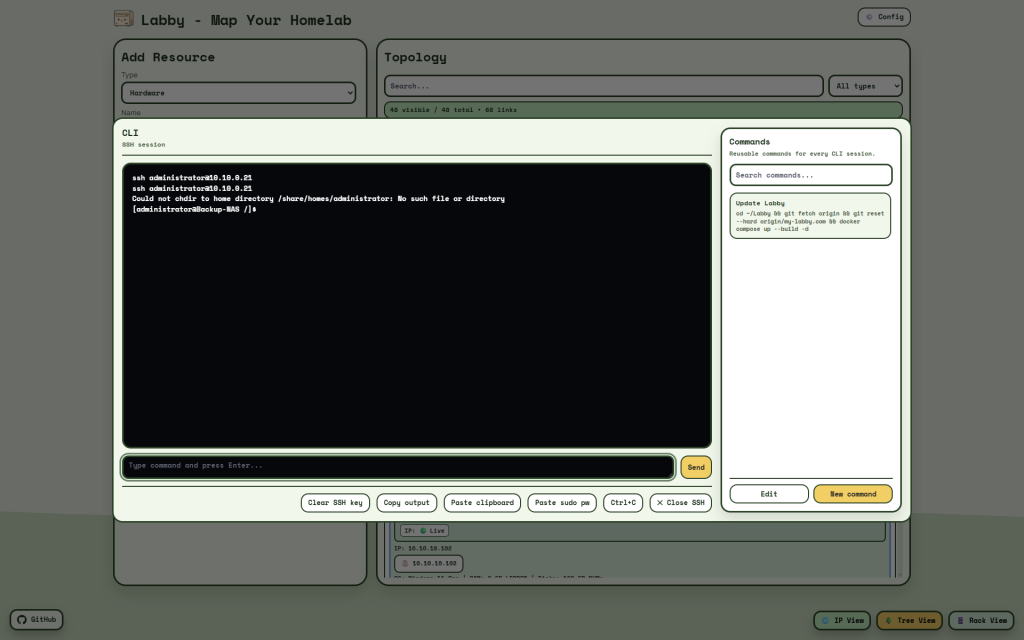
Labby now includes an integrated CLI tool for quick SSH access directly from your homelab map.
With the CLI, you can connect to your devices without leaving Labby. Stored credentials and SSH keys can be reused for faster access, so you do not have to enter the same connection details again and again.
The CLI window also includes a reusable command library. You can save frequently used commands, search them, and run them whenever you need them. This is useful for update commands, maintenance tasks, Docker Compose workflows, log checks, and other recurring administration steps.
Common CLI actions such as clipboard paste, sending the saved sudo password, interrupting running commands with Ctrl+C, and closing the SSH session are available directly in the interface.
All CLI-related settings, saved command snippets, credentials, and relevant configuration data are included in Labby’s config backup system.
Demo Version
I also created a demo version at:
The demo is intentionally different from the self-hosted version. It stores data only in the browser and automatically loads demo entries.
This lets people try Labby without installing anything.
The demo includes example networks, hardware, apps and racks, so visitors can immediately see what Labby is meant to do. On the website you can also find a fulle stretched out wiki.
Built With AI Assistance
One thing I want to be transparent about: Labby is a vibe-coded project built mainly with help from Codex by OpenAI and Claude by Anthropic.
I used AI heavily during development, but the project direction, testing, feature decisions and iteration came from my own needs and ideas.
This workflow helped me move much faster than I could have alone. At the same time, it also meant I had to test a lot, fix many small issues and continuously refine the UI until it worked the way I wanted.
Installation
Labby can be self-hosted with Docker.
services:
  labby:
    image: techbygiusi/labby:latest
    container_name: labby
    ports:
      - "8080:80"
    volumes:
      - labby-data:/data
    restart: unless-stopped

volumes:
  labby-data:
To start it:
docker compose up -dThen open:
http://localhost:8080To stop it:
docker compose downData is stored in a Docker volume and survives container restarts.
How Labby Works
Labby has a clean architecture: Frontend-first with optional backend.
When you add a resource, the frontend displays it instantly. Changes sync to the backend, which stores your data permanently as JSON. This means you can access the same homelab map from any device.
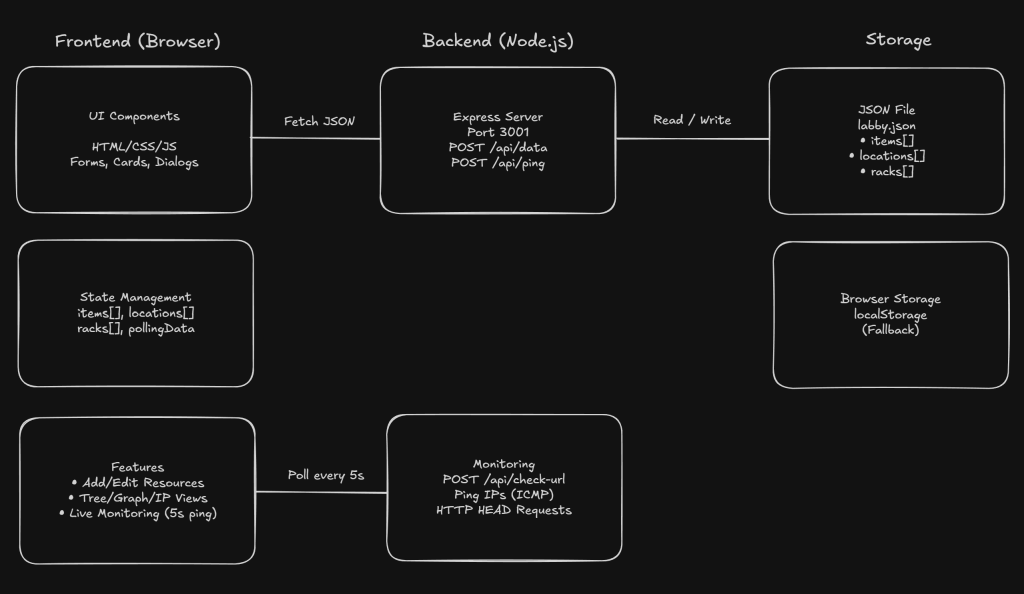
Live Monitoring is one of the unique features. You can set a resource’s status to “Live” and Labby automatically pings IPs and checks URLs every 5 seconds. Status updates appear on your cards in real-time-🟢 online, 🔴 offline.
Everything connects. An app runs on a VM. The VM runs on a Proxmox host. The host connects to a switch. The switch belongs to a network. This relationship data powers Tree View, Graph View, and IP tracking. One array stores all connections, and the UI visualizes them automatically.
The self-hosted version stores data in Docker, so your homelab map persists and syncs across devices. The demo version uses browser storage only—no installation needed to try it.
Final Thoughts
Labby started as a simple idea: I wanted a better way to map my homelab.
It has now grown into my biggest project so far, with inventory management, topology views, IP tracking, rack layouts, themes, mobile support and persistent storage.
There is still more I want to improve, but I am proud of how far it has come.
If you run a homelab and want a clean way to document it, give Labby a try:
And if you want permanent storage, self-host it.


Leave a Reply